You chose a pump with a high flow rate on its datasheet. But in your actual device, it delivers just a trickle, stalling your project and causing major redesigns.
To correctly match a dc micro pump, you must plot your system’s resistance (the load curve) and overlay it with the pump’s performance graph (the P-Q curve). The true performance is the single point where these two curves intersect, which is often far from the datasheet’s maximum values.

In my 22 years at JSG DC PUMP, this is the most common and costly mistake I see bright engineers make. They focus entirely on the pump’s specifications, believing a pump rated for “40 L/min” will deliver 40 L/min. But a pump doesn’t operate in a vacuum; it works against the resistance of your system. You have to understand how your system fights back against the pump to find the true point of equilibrium where they work together.
How Do You Determine the System Load Curve for Your DC Micro Pump?
You know you need to find the “system curve,” but it sounds like a complex, theoretical exercise. Ignoring it means you’re just guessing, leading to endless trial-and-error with different pumps.
You can map your system’s load curve by identifying every component that adds resistance to the flow. By calculating the total pressure loss (back pressure) at several different flow rates, you can plot a curve that represents your system’s unique demands.

The system load curve is simply a graph of how much back pressure your device creates at any given flow rate. Think of it as the system’s “personality.” A restrictive system will have a steep curve, while a very open system will have a shallow one. The key is to quantify all the sources of resistance that the pump must overcome. This isn’t just about theory; it’s about making a predictive model of your system’s behavior. If this process seems daunting, it’s a standard part of the collaborative process at JSG DC PUMP. Speak with one of our engineers to get help analyzing your system’s unique load curve.
Identifying Sources of Back Pressure
Every component in the fluid’s path adds to the total back pressure. You must consider all of them.
| Component | Type of Resistance | Impact on Performance |
|---|---|---|
| Tubing | Friction Loss | Longer or narrower tubes drastically increase back pressure, especially at higher flows. |
| Filters & Valves | Obstruction Loss | Cause a pressure drop. A clogged filter can increase back pressure significantly. |
| Nozzles & Orifices | Restriction Loss | Intentionally create high back pressure to increase exit velocity or control flow. |
| Liquid Height (Head) | Static Pressure | Lifting a liquid requires a constant amount of pressure, regardless of flow rate. |
| Fluid Viscosity | Friction Loss | Thicker fluids (like oil vs. water) require much more pressure to move at the same rate. |
How Does a DC Diaphragm Pump’s P-Q Curve Reveal Its True Performance?
The pump datasheet lists maximum flow and maximum pressure. But it never provides both at the same time, leaving you to guess what the real output will be under load.
A DC diaphragm pump’s P-Q (Pressure-Flow) curve reveals its true capabilities by showing the inverse relationship between pressure and flow. It graphically displays the exact flow rate you can expect for any given back pressure your system creates, removing all guesswork.
I once had a client developing a portable air mattress inflator who fell into this exact trap. They chose a DC air pump from a catalog advertised with “40 L/min” free flow. They expected their product to inflate in under a minute. In reality, it took over five. The problem was that “free flow” only exists at 0 kPa of back pressure—when the pump is blowing into open air. As the mattress fills, its internal pressure rises. Looking at the pump’s P-Q curve, we saw that as the back pressure increased to just 5 kPa, the flow rate dropped from 40 L/min to only 8 L/min.
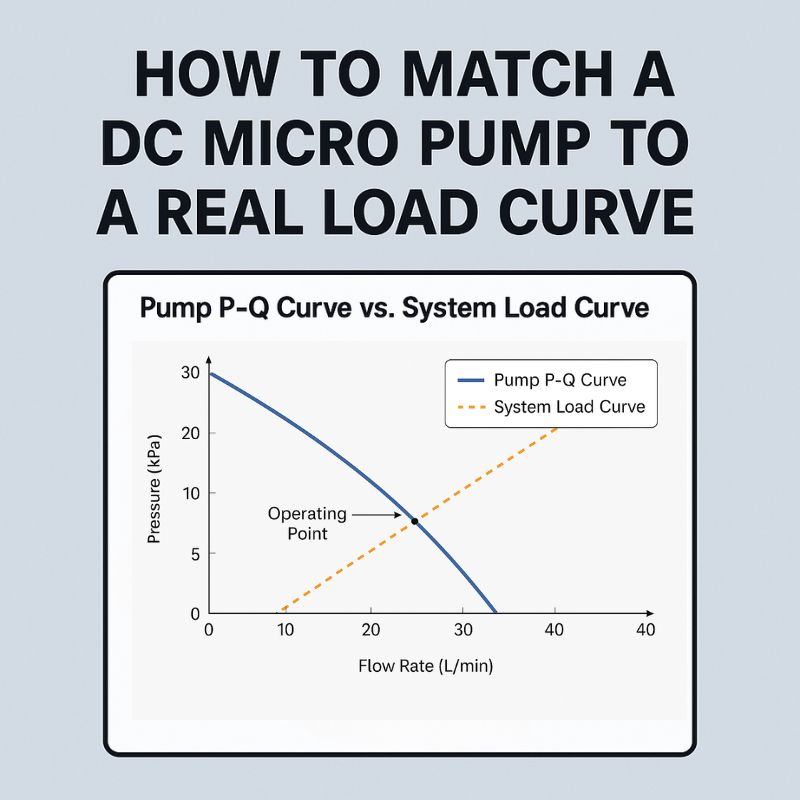
The Operating Point: Where Curves Collide
Your system’s actual performance is found at a single point: the intersection of the pump’s P-Q curve and your system’s load curve.
- The P-Q curve shows what the pump can supply.
- The system load curve shows what the system demands.
The pump will naturally run at the point where supply equals demand. This is why we provide detailed P-Q curves for all our products. You can explore the datasheets for our full range of pumps at JSG DC PUMP to begin your analysis.
How Do You Select a DC Air Pump or DC Vacuum Pump with this Method?
You have your system curve and a stack of pump P-Q curves. Now you need a clear process to put them together to choose the perfect pump and avoid costly mistakes.
The selection process is a step-by-step method of matching your needs to the data. First, define your target performance. Then, find that point on your system load curve. Finally, select a pump whose P-Q curve passes well above this point to ensure a robust safety margin.
Let’s walk through a real-world example for both an air and vacuum application. The goal here is to move from abstract curves to a concrete decision. This structured approach removes emotion and guesswork from the process, replacing it with data-driven confidence. It ensures the pump you choose will not only work but will perform reliably under all expected conditions, including worst-case scenarios like a partially dirty filter or colder, more viscous fluid.
Step-by-Step Selection Guide
For a DC Air Pump (Pressure Application):
- Define Target Flow: You determine your device needs 10 L/min of airflow to function correctly.
- Find System Pressure: You test your system (with all its tubes, valves, and nozzles) and find that to achieve 10 L/min, the pump must overcome 15 kPa of back pressure. This point (10 L/min, 15 kPa) is your target operating point.
- Select the Pump: You look for a pump whose P-Q curve passes significantly above your target point. If Pump A’s curve passes through (10 L/min, 20 kPa), it’s a good choice. It has a safety margin. If Pump B’s curve only passes through (10 L/min, 16 kPa), it’s risky, as small changes could cause it to underperform.
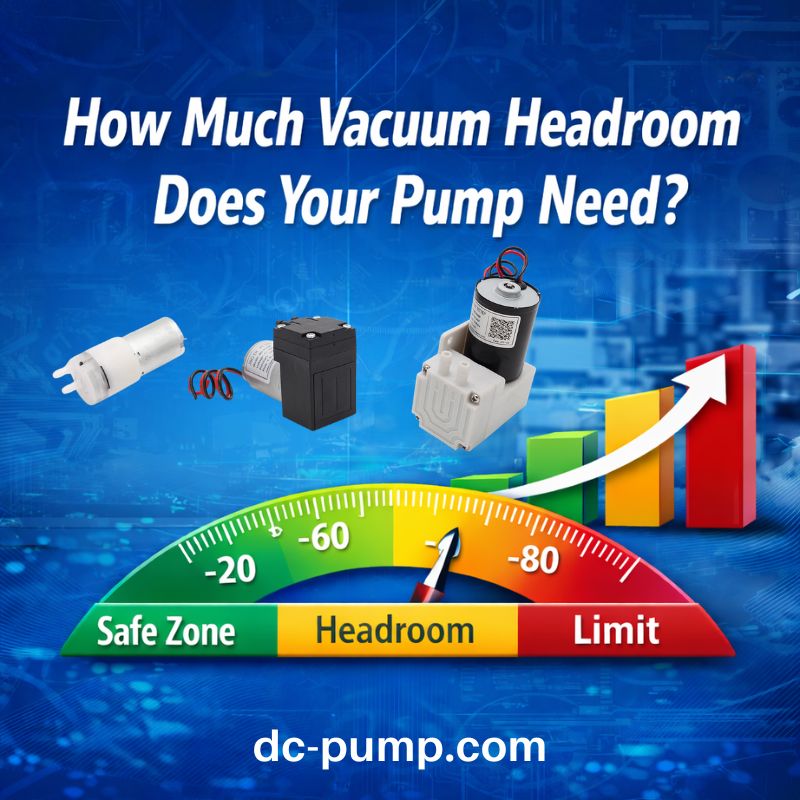
For a DC Vacuum Pump (Vacuum Application):
- Define Target Vacuum & Flow: You need to achieve and hold a vacuum level of -50 kPa while maintaining a flow of at least 2 L/min to remove air from a chamber.
- Find System Characteristics: Your target operating point is (-50 kPa, 2 L/min).
- Select the Pump: You review vacuum pump P-Q curves. You need a pump that can provide more than 2 L/min of flow when pulling against a -50 kPa vacuum. You select a pump that provides 3 L/min at -50 kPa, giving you a 50% performance margin for reliability.
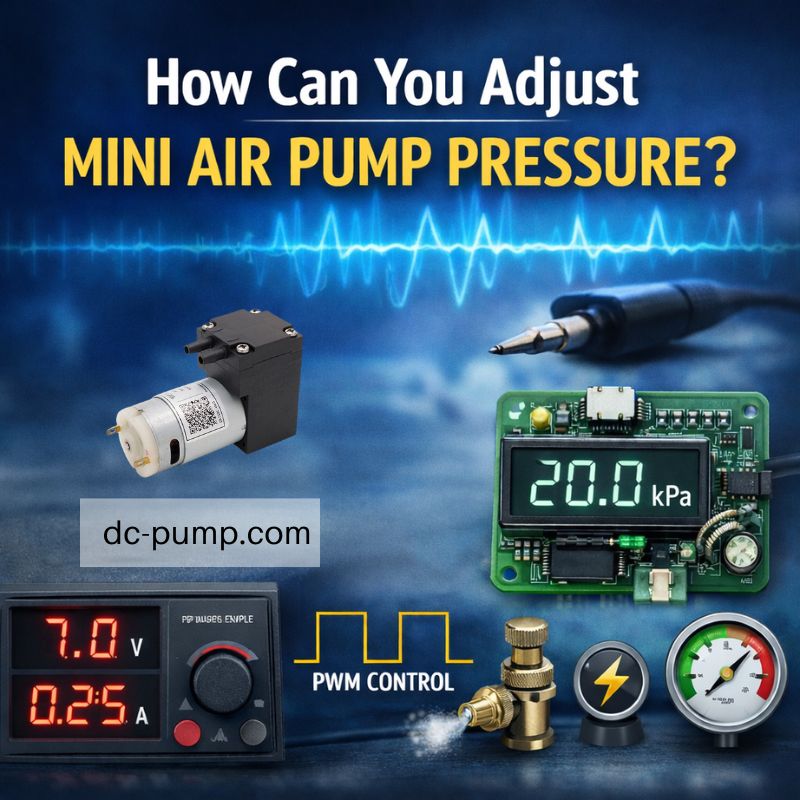
How Can You Fine-Tune Performance with PWM Speed Control?
You selected a pump that is slightly too powerful. Now your device works, but it’s noisy and wasting battery life, while a smaller pump would be too weak for the job.
PWM (Pulse Width Modulation) speed control allows you to adjust the pump’s motor speed, creating a new family of P-Q curves from a single pump. This lets you precisely dial in the desired operating point, optimizing for performance, noise, and energy consumption without changing hardware.
Rather than thinking of a pump as having one static P-Q curve, PWM control gives you a whole range of curves to work with. By varying the duty cycle of the voltage signal to the motor, you change its effective speed. This gives you incredible flexibility. Many of our brushless DC micro pumps include PWM control as a standard or optional feature.
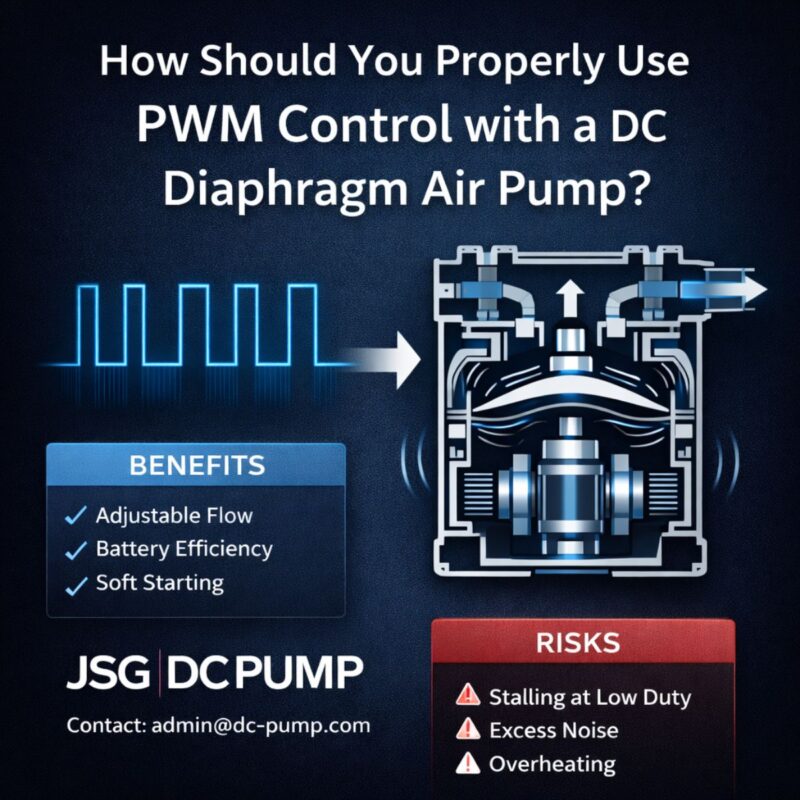
Benefits of PWM Control
| Feature | Description | Key Advantage for OEMs |
|---|---|---|
| Performance Tuning | Precisely match the system load curve without changing hardware. | Reduces need for multiple pump models; one pump can serve varied needs. |
| Noise Reduction | Lowering pump speed significantly reduces operational noise. | Crucial for devices used near people, like medical or home appliances. |
| Energy Efficiency | Running the motor slower drastically cuts power consumption. | Extends battery life in portable devices and reduces heat output. |
| Increased Lifespan | Operating below maximum speed reduces wear on the motor and diaphragm. | Enhances overall product reliability and longevity. |
What Common Pitfalls Lead to a Pump Mismatch?
You followed the entire process, but the result still isn’t perfect. Hidden variables and overlooked details are causing unexpected performance drops, frustrating you and your team.
Common pitfalls that lead to a mismatch include ignoring viscosity changes with temperature, underestimating pressure drops from tight-radius tube bends, or failing to account for how filters clog over time. These real-world factors can dramatically shift your system’s load curve and invalidate your initial pump selection.

I always advise engineers to design for the worst-case scenario. Your beautiful lab prototype is not the device your customer will use in two years. That device might have a clogged filter, a kinked hose, and be operating in a cold garage. This is why adding a healthy safety margin is smart engineering. This is a core part of our philosophy at JSG DC PUMP. We don’t just sell pumps; we partner with you to build a reliable product for the long term.
Troubleshooting Your System Performance
| Observed Problem | Possible Cause(s) | How to Fix or Prevent |
|---|---|---|
| Lower than expected flow | 1. Clogged filter or nozzle. 2. Kinked or bent tubing. 3. Air leak in a vacuum line. 4. Fluid is more viscous than planned (e.g., lower temp). |
1. Add a service interval for filter cleaning/replacement. 2. Use rigid elbows for tight bends; specify minimum bend radius. 3. Check all fittings and seals. 4. Test across the full operational temperature range. |
| Excessive noise or vibration | 1. Pump is oversized for the application (running near free flow). 2. The pump’s mounting is resonating with the chassis. |
1. Use PWM to reduce pump speed to match the load. 2. Use rubber grommets or other vibration-dampening mounts. |
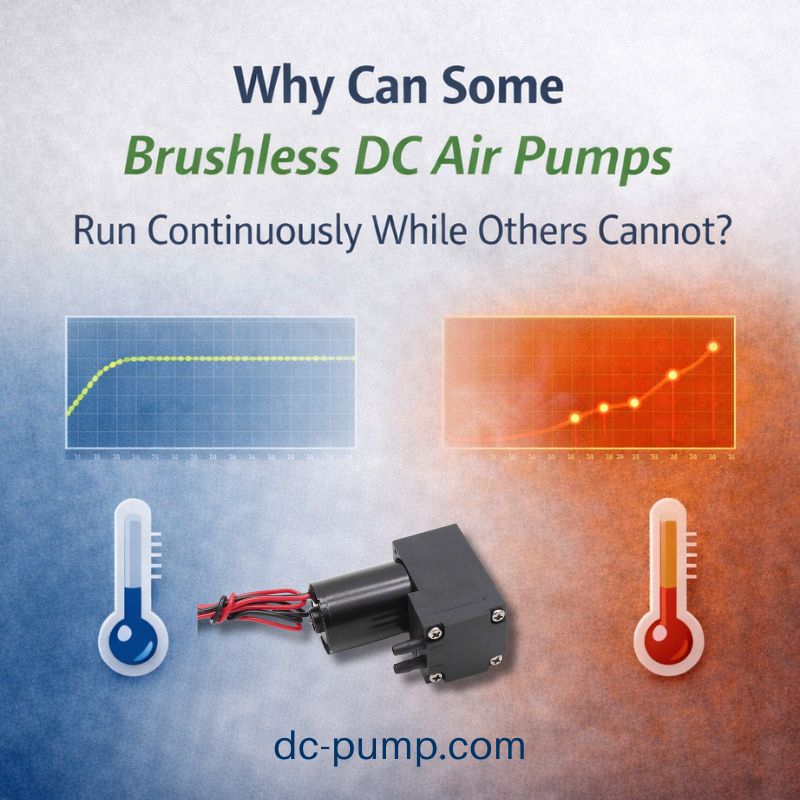
| Pump overheats / high current | Pump is undersized and forced to run near its maximum pressure (stall condition), causing inefficiency and strain. | Re-evaluate the system curve and select a more powerful pump with a sufficient safety margin. |
Conclusion
Stop relying on datasheet maximums. By matching your system’s load curve to the pump’s P-Q curve, you will achieve the performance your device requires. For a partner in this process, visit us at dc-pump.com.